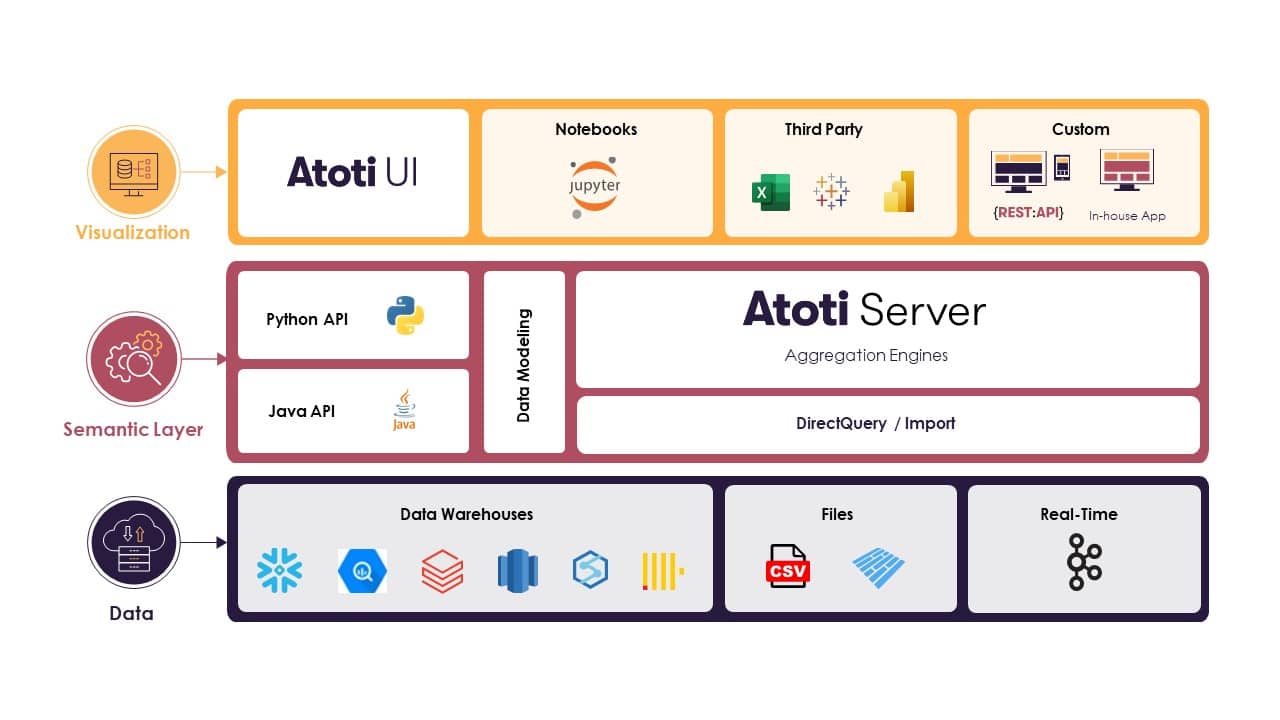
Atoti is the data analytics platform developed by ActiveViam for the financial services industry. Leveraging Google Cloud’s BigQuery, Atoti effortlessly enables interactive, self-service analysis of complex financial metrics over cloud scale datasets at any level of detail.

Today most financial institutions are moving to the Cloud, transferring even the most critical applications. Many seek the convenience of managed infrastructures, which are always up-to-date, interconnected,offering flexibility and elastic scalability. Additionally, they offer access to flagship technologies that only exist in the Cloud, such as Google Cloud’s BigQuery.
Consider a market risk or credit risk platform of an investment bank that is on Google Cloud. Risk engines can run on elastic grids on Google Compute Engine, generating large amounts of results that can be stored on Google Cloud Storage at huge throughput. Reference data can be booked in a Cloud SQL managed database. This data can be loaded and prepared for analysis in BigQuery.
Only the data analytics “last mile” remains unsolved due to special requirements that general purpose visualization and business intelligence tools do not address:
- Self-service analysis of complex financial metrics from top-of-house to trade level on large volumes of data
- Real-time continuous re-aggregation of metrics based on live market data and transaction feeds for front office use cases
- Instantaneous processing of user generated data updates for operational workflows such as signoff, pre-deal checking and what-if analysis
Continuing with this example, market risk metrics commonly involve non-linear, array-based, multi-step aggregations that cannot be modeled in a BI tool whose comfort zone is “sum of sales per quarter”. This is the case with Value at Risk and Expected Shortfall formulas, or when estimating a PnL in real time using gamma ladders and market data shifts.
Therefore, the intuitive “put a BI tool on top of the database” idea does not work. Even for simpler metrics, it’s often not fast enough for interactive analysis.
To work around this, IT teams write bespoke code to pre-calculate and pre-aggregate the metrics or they allow the business users to extract the data and calculate metrics in spreadsheets and notebooks. These measures are not satisfactory. Pre-calculation leads to static reports; business users are deprived of the flexibility to group metrics differently, change the level of detail or filter out elements unless they go back to IT. Additionally, spreadsheet solutions have limited means and require one to work with summarized data, creating key person dependencies and a lack of transparency. It is a “slow IT” versus “shadow IT” dilemma.
Atoti was designed to solve this problem. Atoti introduces a new generation of multidimensional data modeling with the flexibility to describe all of the financial metrics and to explore those metrics in real time – from top-of-house to trade level – with complete freedom. No pre-calculation step is needed as everything is aggregated on-the-fly.
Atoti can load data in-memory and run standalone or make live queries to an external database called the DirectQuery mode. The two can be combined for hybrid deployments that require high speed on hot data and access to large and detailed historical data.
Google Cloud’s BigQuery was one of the first data warehouses supported by Atoti DirectQuery, in line with the growing interest of the financial industry for the platform. Today, BigQuery is the most accomplished platform for market risk, credit risk and liquidity risk analytics, addressing the special needs of the industry while being completely turnkey.
Capabilities of Atoti using Google Cloud’s BigQuery:
- Create risk data models on top of the raw data stored in BigQuery, ready to be used within minutes.
- Enable self-service analysis of the risk metrics at any level of detail by end users.
- Scale from fast and flexible ad hoc analysis to large scale enterprise applications with the same platform.
- Precisely optimize for cost and performance, combining the Atoti in-memory engine and the scalable BigQuery to support intensive operational workflows and cost effective historical analysis in the same application.
Example: How to begin a market risk project
- Collect the booking data in BigQuery, reference data and the raw data generated by the risk engines. Sensitivities per trade for sensitivity analysis, or historical PnL vectors per trade for Value at Risk, for instance.
- Install Atoti on a VM (or deploy the Atoti VM from the GCP marketplace).
- Open a Python notebook and create a data model step-by-step using the Atoti Python API:
- Connect to the BigQuery tables
- Define business hierarchies such as “AsOfDate” “Booking”, “Product” based on the attributes of the BigQuery tables
- Define risk metrics such as SUM(delta) or Value At Risk 99, Expected Shortfall
- Share the URL of the Atoti UI with business users so that they can explore and analyze metrics in self-service, in pivot tables, charts and dashboards (it can also be done directly in Excel, Tableau and other front ends).
Illustration 1: Define a multi-level hierarchy with the Python API

Illustration 2: Define the Value at Risk formula
![]()
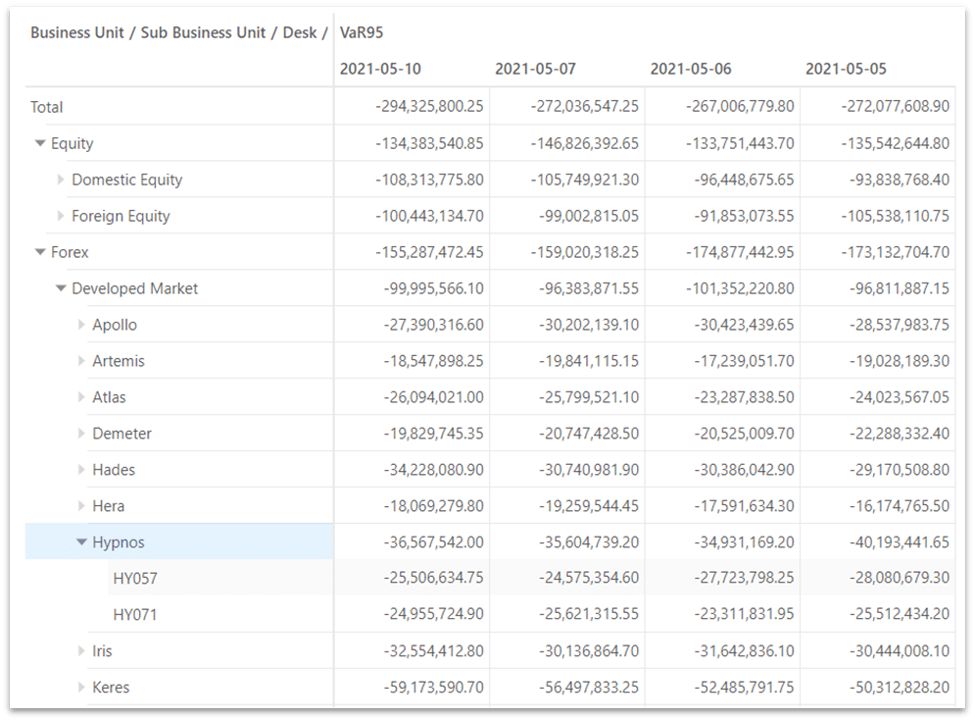
Illustration 3: Self-service analysis of Value at Risk

Ultimately, Atoti complements BigQuery with a semantic layer that converts tables and columns into business hierarchies and metrics that end users can analyze on-the-fly and by themselves.
If you’d like to book a demo or start a free evaluation of Atoti on Google Cloud, contact us at https://www.activeviam.com/contact-us/


