A month after announcing Claude 4, the latest update to their LLM, Anthropic held a conference in July dedicated to the finance industry that got quite a bit of attention.
What really stuck with me from this event were two things:
- It’s no longer about incremental LLM improvements as the main selling point. We can probably assume that, in their current form, they won’t make dramatic leaps anymore. What will really move use cases forward, and deliver results, is how easily data sources can be consumed and discovered by AI agents.
- In all banks, the main roadblock to AI adoption is regulation and the complexity of implementation, especially with technologies that keep changing. Anthropic now wants to “show how it’s done” — and maybe even take on part of the implementation themselves.
Anthropic’s demo focused on the work of a research analyst digging into an investment opportunity, pulling up stock prices, fundamental analyses, earnings calls from data providers like FactSet or S&P, and then putting together a summary with charts.
It’s pretty impressive to watch. One YouTube viewer even commented, “There will be zero edge in fundamental analysis soon.”
It’s a well-chosen use case too: it relies on data that’s easy for humans (and therefore the LLM) to understand, follows a fairly structured fundamental analysis process, and plays right into the LLM’s strength at summarization.
But can we take it further from those human-interpretable market datasets towards model-oriented quantitative datasets where arguably there’s even more to gain in terms of AI automation?
I’m talking about datasets with millions of trade-level rows, sensitivities, and risk-factor simulations:
- Granular market/risk data – highlighting the transaction-level or factor-level detail.
- Analytical datasets – built to feed risk engines, pricing models, or simulations rather than humans.
- Position and risk factor data – the raw building blocks for VaR, P&L attribution, stress testing, etc.
- High-dimensional financial data – emphasising the huge number of variables (risk factors, scenarios).
Humans (and AIs) can’t make sense of this raw granular data as is. First, you need to aggregate it into meaningful business groups and metrics that quantify performance or risk.
In this field, where the norm has long been either letting the business deal with raw data (tables and columns, exports, spreadsheets) or producing batch reports, Atoti brought a fresh approach that quickly became the gold standard in big financial institutions.
Atoti offers a high performance “semantic model” that lets business users analyze any metric by any business dimension, without mistakes and without waiting. All the hierarchies structuring the business are modeled and made available, along with all metrics from simple ones (SUM, COUNT, STD…) to complex ones (P&L Explain, VaR, Expected Shortfall, CVA, LCR, FRTB capital requirements…). Like a pivot table on steroïds, users can slice and dice metrics along hierarchies freely, instantly, and without errors. It’s Atoti that knows the business logic to calculate these metrics and how to roll them up from trade level and across hierarchy levels.
Why did I take the time to explain how Atoti works? Because this ability to add business meaning to trade-level data,and to provide explainability and actionability by calculating everything on the fly, was originally designed to help humans. But it turns out to be the key to really enable AI.
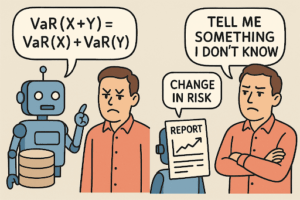
Let’s say we want to automate part of a risk analyst’s job when they sign off on the daily Value at Risk. We can tell (prompt) an AI agent what to look at, and in what order, just like we would explain it to a junior analyst. But then the agent needs to be able to access the VaR figures.
One idea could be to give the agent access to a database with the trades and P&L vectors. You often hear about LLMs being able to write SQL queries, so in theory they should be able to “handle it.” In practice, this only works for very common aggregations—like total sales per quarter. For more complex and less frequent calculations, AI isn’t reliable.
Instead, we could precompute a report with the VaR per book for yesterday and today, for example. This time, the VaR aggregation method is reliable and governed. The agent would be able to spot which books had a big change in their risk. But that’s as far as it goes—where the right approach would be to keep going, filter each problematic book and drill down by instrument, by region, and so on. With a static report, the agent is stuck and reduced to just commenting on it.
Now with Atoti: the agent connects to Atoti (to the Atoti MCP server to be precise, more on this later), pulls the list of dimensions (including booking) and measures (including VaR), which enriches its context. It can then match these business objects with what it’s being asked to do in its “risk analyst” prompt. The agent also learns how to query Atoti, reusing the hierarchies and metrics already defined and governed there.
With this new power, the agent can start from the “VaR per Book” view, spot the books that stand out, and then run all sorts of deeper analyses described in its prompt, querying Atoti again and again with different hierarchies, levels of detail, filters, and even other metrics correlated with VaR.
The result: a reliable agent that can actively analyze and truly save time for the human analyst. When we built the first prototypes of this concept with our clients, it was really exciting to see how quickly the agents understood the cube on their own — it felt like it “just worked.”
And this blog only scratches the surface; thanks to its speed and support for incremental data updates, Atoti is also great for scenario analysis and what-ifs. Imagine AI agents that can run these what-ifs on demand, just by understanding a business user’s natural language request — or even automatically include pre-deal checks to respond to a client’s RFQ.
By the way, we’re talking in the present here, not about a plan for the future.
Conclusion
Semantic layers have been around for a bit, but their role in agentic AI is about to make them indispensable. And in quantitative finance, only Atoti can handle real-world complex non linear metrics and what-if analysis, making it a true power tool for both humans and agents.
For heavy-duty analytics like risk, P&L, and performance in large financial institutions, Atoti isn’t just a bridge between data and AI, it’s the indispensable gateway to deploying AI agents that can take over today’s analyst workflows and free up talent for higher-value work. In this space, there’s nothing else like it.
This short post kicks off a blog series where we share our vision for AI in the analytical and operational workflows of large financial institutions, and how Atoti fits into the modern AI stack.