There are many different data visualization platforms on the market. Most are made for very general purposes. These often lack the specialized tools that financial services need for tasks that they perform on a daily basis. There are often vast amounts of data to display and complex aggregations that can slow down conventional BI tools.
The R&D team at ActiveViam has recently updated Atoti UI 4 to meet the increasing demands of users, improving its performance and user-friendliness to make it the latest and most advanced data visualization tool for Atoti.
Using WebSockets to get real-time incremental updates, it is the best data visualization tool for communicating with the Atoti Server. We put an extra emphasis on UX and performance in order to provide the best experience for end-users.
Specializing in tools for financial services, Atoti UI is an off-the-shelf web application used for live, collaborative data exploration. We have taken care to provide the most useful analytics tools for the finance industry. Our pivot tables are among the best on the market. We also offer storytelling capabilities and excellent drillthrough tables.
A fully functional application by itself, Atoti UI is also extendable and integrable. Developers can create custom plugins tailored to their needs. Additionally, they can use the Atoti JavaScript API to integrate Atoti components into existing applications.
Best-in class components
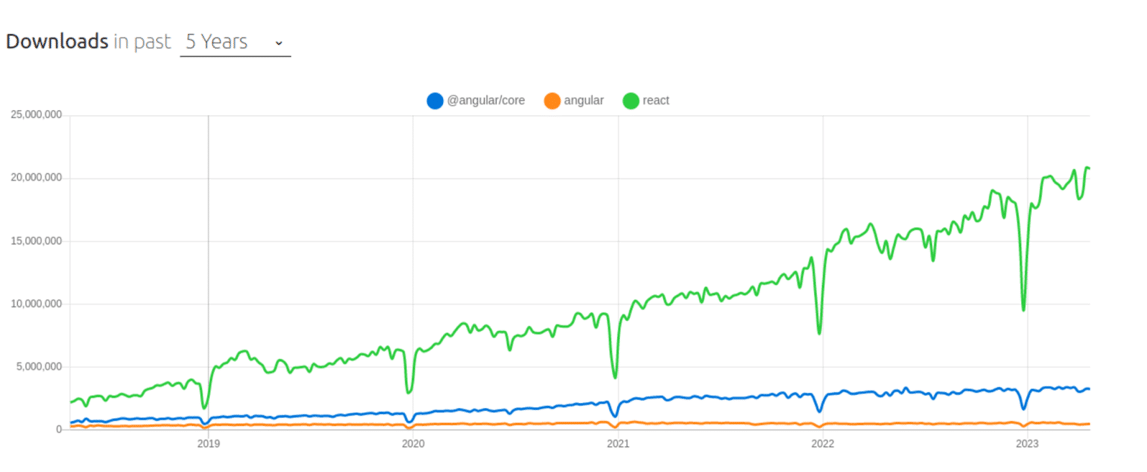
Just as in Atoti UI 4, we decided to use React as our main library for Atoti UI 5. This is a choice we originally made in 2016 which has been proven to be the correct one. React’s popularity has been steadily increasing. When we designed Atoti UI 5, we found no reason to switch.
We now use Redux to manage the application state. It is one of the most popular state management libraries, as it makes it predictable and robust. Our API allows users to define store enhancers so that developers of Atoti UI extensions can hook into the application state.
Our entire codebase is now written in TypeScript. The strong typing makes our code more robust and maintainable, and makes our API easier to discover and read. This speeds up development time both internally and for consumers of our API. We also combine it along with some other tools to automatically generate markdown documentation for our API.
Atoti UI 5 introduced module federation as one of its main innovations. The core of the Atoti UI application is pre-built. Developers only need a few seconds to build their extensions on top of it.
The design of Atoti UI is specifically crafted to avoid running or repeating queries unnecessarily, such as when making changes to the dashboard layout or moving between different dashboard pages.
We optimize performance by lazy-loading large datasets. This means that we load data in chunks as the user scrolls, instead of loading it all at once. Atoti UI virtualizes many of its components, such as tables. It does this by only rendering the part of the data chunk that fits on the user’s screen.
We use React lazy and React Suspense to speed up the loading time of our application. This ensures that the JavaScript code for a given component is only loaded when it is needed.
For example, if you never use line charts in your dashboards, the corresponding code will never be loaded in the browser.
Combining these technologies, Atoti UI is a fast front-end application, tailor-made to support the powerful Atoti Server backend and to best serve the needs of finance analytics professionals. It can be used straight out of the box or with custom extensions to fit any use case needing to deal with vast amounts of data.